Blog

Jeremy Li, Director of Data Science - Sep 25, 2023

A deep dive into Explorer analysis cloud

The remarkable increase in the scale of genomic data being generated over the last decade has made an elegant solution to genomic data analysis at scale a holy grail of sorts for computational geneticists and biologists.

At Gencove, we have repeatedly seen the complexity and insufficiency of existing tools limit research teams from fully unlocking the value of their genetic data. Even with recent attempts at solving various parts of the problem of efficiently analyzing genomic data at scale, there remain a number of challenges to researchers and scientists:

  • Defining complex data pipelines is an involved process and often requires learning new purpose-built languages
  • Maintaining large-scale computing clusters requires operational complexity and engineering overhead
  • Large, modern NGS datasets requires deploying scalable and reliable storage solutions
  • Moving newly generated data into existing storage systems requires complex integrations and a nontrivial amount of time

To address these current shortcomings, we built Gencove Explorer, a general-purpose data analysis platform geared toward applications in genomics with tooling to enable the easy processing, querying, and analysis of arbitrarily large genetic datasets.

Gencove Explorer represents a full-stack solution that addresses all of these challenges within a single integrated platform and with a minimal learning curve. In doing so, Explorer accelerates the rate at which scientists can answer critical biological questions, and furthers our goal of delivering insights that advance global health and sustainability.

Gencove Explorer analysis cloud

Explorer enables data scientists and researchers to focus on answering biological questions by abstracting away the need for managing scalable computational infrastructure.

Although Explorer is built with special consideration for genomics applications and Gencove datasets in mind, it is a general-purpose computing platform on which general scientific computing can be easily performed.

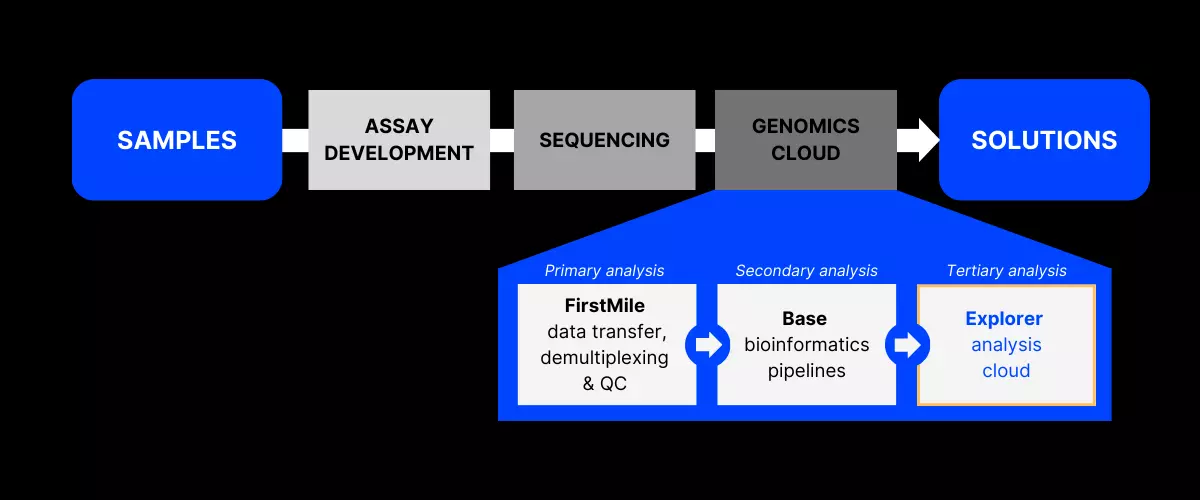
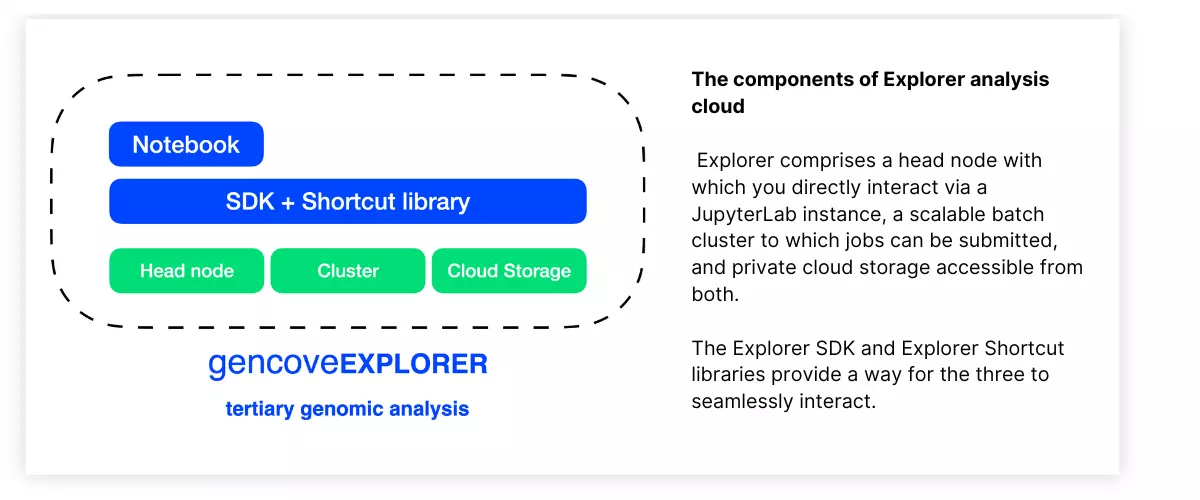
Explorer allows you to organize, analyze, and visualize your data all in one place. At a high level, Explorer comprises the following systems:

  • An Explorer instance, which is a dedicated Linux machine with which you interact through a hosted JupyterLab instance
  • A scalable compute cluster (up to tens of thousands of CPUs), to which you can submit arbitrary analysis jobs from within your Explorer instance
  • A persistent object store providing private cloud storage, on which you can store your data and analysis outputs
  • The Explorer SDK, a lightweight Python package which makes it easy to interface with both the compute cluster and object storage and which additionally provides a native integration with Gencove-generated data
  • Explorer Shortcuts, a Python package which provides off-the-shelf functions to perform commonly required tasks such as merging VCFs, filtering alignments, VCF annotation, genotype concordance calculations, and more

For those with a more traditional cluster computing background, one can think of the Explorer instance as the head node of a cluster, on which light analyses can be performed and from which jobs that require heavy lifting can be submitted to the Batch cluster through use of the Explorer SDK. The difference here is that persistent object storage is achieved through the use of private cloud storage rather than, for example, a shared filesystem on the compute nodes of the cluster.

A variety of abstractions for cluster jobs and input/output files are implemented in the Explorer SDK.

Particularly of note is an abstraction of an "analysis" (implemented through a Python Analysis object), which encapsulates a "work function", a user-defined function which allows interleaved shell and Python code, along with the inputs and outputs associated with a job that is submitted to the Explorer cluster. This abstraction enables the straightforward definition of an arbitrary analysis that can leverage both bioinformatics shell tools (e.g., PLINK, samtools, bcftools, etc.) as well as Python.

Furthermore, the SDK enables the definition of dependencies between multiple different analysis jobs, such that entire workflows with various sequential and interdependent steps can easily be defined and executed on the Explorer-provided cluster (without having to manage the underlying infrastructure) as long as the workflow can be represented as a directed acyclic graph (DAG).

By bundling an on-demand computing cluster with a genomics-oriented SDK and native integration with other existing elements of the Gencove platform, data science and research teams are empowered to spend their time focusing on the analytical elements of scientific research rather than dealing with the dual challenges of managing complex infrastructure and the operational complexity that comes with having to navigate multiple systems.

Example: Analyzing depth of coverage at a lactose intolerance locus in thousands of samples using Gencove Explorer

In this section, we will walk through a common use-case in genomics in which a researcher performs descriptive quality control of whole-genome sequence data as part of a common workflow when investigating genetic variation at a locus.

In particular, we will use Explorer to query and plot the depth of coverage at rs4988235, a locus associated with lactose intolerance in humans, in a publicly available 30x WGS dataset of alignments of approximately 2500 individuals comprising the 1000 Genomes Phase 3 release.

This is a relatively simple example, but it illustrates a few key features:

  • You can define a function to be run in parallel on a scalable batch cluster
  • You can return and retrieve data
  • You can access a private object store

All the following code is being written and run on a Gencove Explorer instance.

Import the Gencove Explorer SDK

We start by importing the classes that we will use in this example from the Gencove Explorer SDK, as well as a couple other standard Python modules for visualization. The SDK is by default installed on all Explorer instances.

from gencove_explorer.analysis import \
	(Analysis, AnalysisContext, JobDefinition, InputShared)
from gencove_explorer.file import File

# visualization imports
from pprint import pprint
import matplotlib.pyplot as plt

Defining the datasets under analysis

The CRAM files for the dataset we are analyzing are publicly available on AWS S3 at s3://1000genomes. Here we load in a file with the sample names and URLs to the CRAMs and print the first few entries for illustrative purposes.

# Get the list of sample CRAMs and sample names
with open("./1kg-valid-crams.list") as f:
    crams = [(line.strip().split()[0], line.strip().split()[1]) for line in f]

pprint(crams[0:4])

which prints:

[('NA06985',
  'https://1000genomes.s3.us-east-1.amazonaws.com/1000G_2504_high_coverage/data/ERR3239276/NA06985.final.cram'),
 ('NA06986',
  'https://1000genomes.s3.us-east-1.amazonaws.com/1000G_2504_high_coverage/data/ERR3239277/NA06986.final.cram'),
 ('NA06994',
  'https://1000genomes.s3.us-east-1.amazonaws.com/1000G_2504_high_coverage/data/ERR3239278/NA06994.final.cram'),
 ('NA07000',
  'https://1000genomes.s3.us-east-1.amazonaws.com/1000G_2504_high_coverage/data/ERR3239279/NA07000.final.cram')]

Since CRAM files store the diff between a reference genome and sequenced alignments, we also require the corresponding reference genome for downstream analysis. We acquired from the reference from this FTP link and uploaded it to the private S3 bucket assigned to our Explorer account.

Since this is a shared dataset across all analysis jobs, we register it in a InputShared as a File object. InputShared objects provide a useful way to define shared datasets or parameters across parallel jobs, and the File class provides an easy interface to work with both local and remote files.

# Define a reference genome file accessible across all jobs
input_shared = InputShared(
    reference=File(
        remote="s3://.../GRCh38_full_analysis_set_plus_decoy_hla.fa"
    )
)

Defining a function that extracts read depth at rs4988235

Here we define a function named get_depth that is to be submitted to the cluster. Note the signature of the function, which takes a single argument of type AnalysisContext, which allows us to pass in the necessary inputs and define the outputs of the job.

The body of the function will be run on the cluster; in this case, this is relatively simple:

  • the sample name and URL to a single CRAM are passed in via the input attribute of the AnalysisContext object
  • the previously registered reference genome is downloaded to local storage
  • the integer read depth at the rs4988235 locus is computed and registered as an output value with a key name set to the sample name of the analysis. This key name allows the later retrieval of the outputs of the job.

Note also that this function definition utilizes iPython magic functions and interleaved Python and bash, which allows the concise invocation of bioinformatics shell tools.

# This function defines a job that will be submitted and run on the cluster
def get_depth(ac: AnalysisContext):
    # Parse input parameters
    sample, cram_url = ac.input
    
    # Retrieve our previously defined reference genome and download it
    # to local storage
    reference_path = ac.input_shared.reference.as_local()

    # Compute read depth using `samtools mpileup` and assign to a variable
    # for later retrieval
    lines = ! samtools mpileup\
        --reference {reference_path}\
	--region chr2:135851076-135851076 {cram_url}\
        --customized-index {cram_url + ".crai"}\
        2> /dev/null\
	| awk '{{print $$4}}'\
	| xargs
    depth = int(lines[0])

    # Save the computed depth as a value that can be retrieved after job completion
    ac.output.depth = depth

Defining a JobDefinition and running an Analysis job

Here we define the computational resources to be assigned to each job using the JobDefinition class, specify the parameters of the Analysis job to be submitted to the cluster, and invoke the .run() method to actually kick off the job. Under the hood, this submits a parallel batch computing job to a scalable compute cluster (in this case, ~2500 jobs each with 1 CPU and 4Gb of memory with a 10,000 second timeout).

Additionally, the SDK provides useful functions to monitor the status of ongoing jobs as well as to retrieve logs (stderr/stdout) of each job in real time.

# Define computational resources for each job
jd = JobDefinition(cpu=1, memory_mb=4000, timeout_seconds=10000)

# Define parameters of the analysis job, which in this case is a batch array job 
# that runs in parallel across each sample
an = Analysis(
    function=get_depth,
    input=crams,
    input_shared=input_shared,
    job_definition=jd,
)

# Execute the analysis job on the cluster
an.run()

Collecting outputs and plotting results

Once the job has successfully completed, we collect its outputs, the read depth values, in a list, and plot them as a histogram using standard Python tooling:

# Collect the output values from each cluster job in a list for plotting
outputs = []
for i, cram in enumerate(crams):
    outputs.append(an.get_output(i).depth)

# Plot the read depth at this site across all samples
fig, ax = plt.subplots(dpi=150)
ax.hist(outputs, bins=50)
ax.set_title("Coverage at rs4988235 in the 1000 Genomes")
plt.show()

Summary

In this example, we showed how a standard genomics data analysis task can be completed using Gencove Explorer. Through simple constructs, we were able to define an analysis, execute it on a large-scale batch cluster, and retrieve and analyze the results.

Note that this is a minimal example showing just a small subset of the features of Explorer and the Explorer SDK. For more information, please see the Explorer Documentation.

Conclusion

Gencove Explorer is a unified, managed computing platform that combines robust computing infrastructure with a flexible, genomics-oriented SDK and native integration with Gencove-generated data.

Furthermore, to ensure smooth onboarding for teams using Explorer, we provide an on-ramp project with dedicated Gencove data science support. This team collaborates directly with Explorer users to identify their goals and implement the initial analysis to achieve them.

By allowing researchers to design and execute complex data pipelines on scalable clusters within a familiar batch computing environment without a significant learning curve or operational overhead, Gencove Explorer represents a significant step toward providing scientists with a streamlined solution to the challenge of efficiently analyzing and storing large-scale genomic data.