Blog

Mamad Ahangari, Data Scientist - Mar 13, 2023

Low pass sequencing plus imputation in cattle outperforms imputation from genotyping arrays

Over the past decade, the cost of genome sequencing has significantly decreased, leading to a rise in popularity of alternative sequencing methods such as low-pass whole genome sequencing instead of genotyping arrays. To meet this demand, at Gencove, we offer a cost-effective solution for generating genome-wide information by providing low-pass whole genome sequencing plus imputation as a high-throughput alternative to genotyping arrays. Our previous research has already established that low-pass whole genome sequencing outperforms traditional genotyping arrays in terms of imputation in humans (Li et al., 2021). In this blog post, we describe the results of our recent experiment where we demonstrate that imputation using low-pass whole genome sequencing is also superior to genotyping arrays in cattle.

Motivation:

The commercial use of genotyping arrays followed by imputation to a haplotype reference panel is a widely used method to generate genome-wide information in cattle for research purposes. However, despite their popularity, genotyping arrays have some inherent limitations that restrict their long-term usage. One such limitation is the pre-defined set of markers selected for inclusion in the array, which can lead to ascertainment bias. In contrast, sequencing technologies agnostically probe the entire genome and provide the potential to identify novel variation. For instance, the BovineSNP50 Array, a high-density genotyping microarray routinely used in cattle genetics, contains just over 51 thousand SNPs distributed uniformly across the genome of major cattle breed types. While these SNPs are highly informative, they provide only a snapshot of the genome that serves as the backbone for the imputation. In contrast, low-pass whole genome sequencing at a target coverage of as low as 0.5x provides a number of reads that are orders of magnitude higher than the number of sites assayed on traditional arrays. This gives far more observations of informative markers for the imputation algorithm which results in more accuracy across the genome. The typical low-pass sequence run at a coverage of ~1x results in measurements at millions of known polymorphic sites in the cattle genome.

Experimental Design:

In this experiment, our primary aim was to identify the inflection point at which low-pass whole genome sequencing surpasses genotyping arrays in terms of imputation performance in cattle. To evaluate this, we randomly selected 50 Holstein and 50 Angus and obtained high-coverage sequence data for them. We then generated low-pass data for these subjects by downsampling the high-coverage data to a range of coverage levels and masked the high-coverage data to the 50k sites on Bovine50SNP Array to simulate high confidence array data for imputation.

In total, we generated seven sets of input data for imputation as follows:

  • Simulated Bovine50SNP Array (51,110 sites)

  • 0.1x

  • 0.5x

  • 1x

  • 2x

  • 3x

  • 4x


Next, each set of input data was imputed to our largest cattle haplotype reference panel in a leave-one-out manner using IMPUTE5 for the simulated array data and GLIMPSE for low-pass sequence data. These two state-of-the-art imputation algorithms are expected to provide the most robust imputation results for array and low-pass data, respectively.

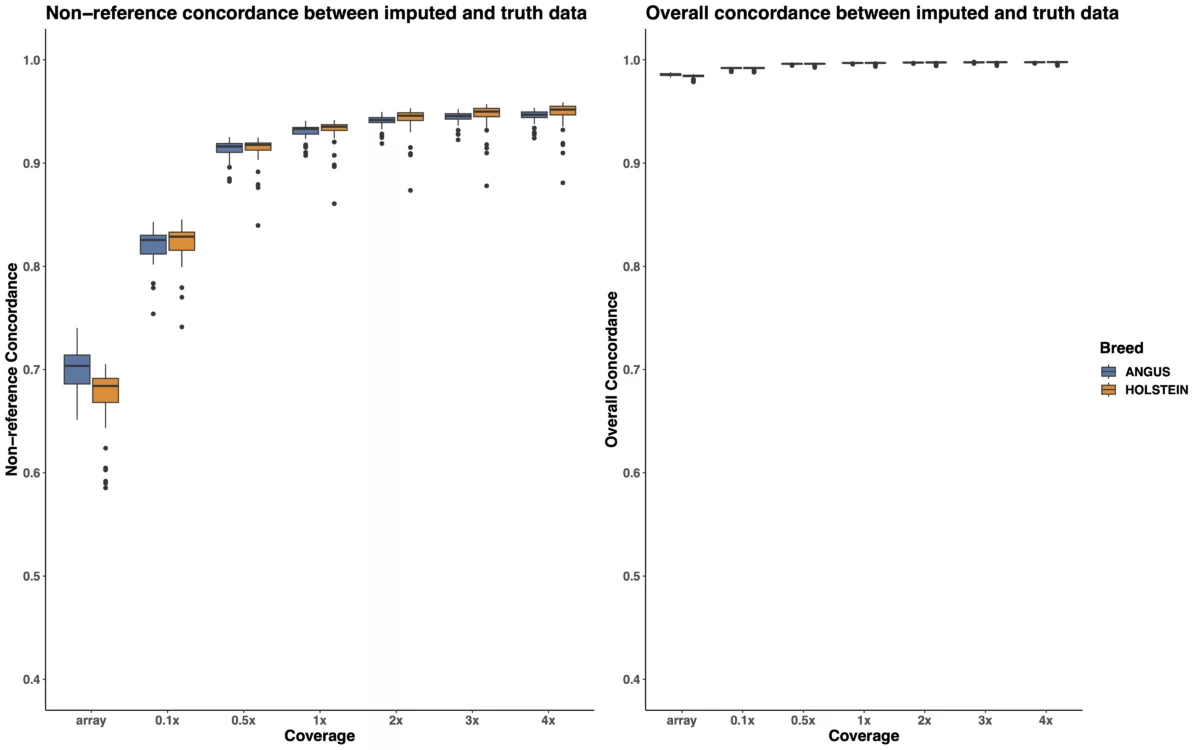
To examine the relative performance of imputed low-pass and array data, we compared the imputed genotypes for each run against the gold standard truth genotypes obtained from our high-coverage reference panel and calculated overall and non-reference concordance estimates for each run. In the context of this experiment, overall concordance refers to the accuracy with which all imputed variants match the gold standard truth genotypes in the reference panel, while non-reference concordance refers to the accuracy with which imputed non-reference variants match the gold standard genotypes for non-reference variants in the reference panel. Because of the high number of reference genotypes included in the overall concordance estimation, overall concordance is generally expected to have less sensitivity while non-reference concordance has better discrimination power for determining the relative quality of imputation for each run.

To provide some additional context, our current cattle reference panel used in this experiment includes 171,774,809 sites from 2,293 samples with high-coverage sequence data that spans a large range of genetic diversity in cattle.

Results:

The boxplots in Figure 1 demonstrate that low-pass imputation at a coverage as low as 0.1x is superior to array-based imputation, in terms of both overall and non-reference concordance estimates. As shown in Table 1 and the left panel of Figure 1, the mean non-reference concordance for array-based imputation is 0.6859, whereas the mean non-reference concordance for the shallowest coverage of low-pass imputation (0.1x) is 0.8216. While increasing the coverage from 0.1x to 0.5x provides demonstrable improvement in imputation quality by increasing the mean non-reference concordance from 0.8216 to 0.9133, we note that increasing the coverage to higher than 0.5x results in quickly diminishing returns in terms of imputation accuracy, suggesting that 0.5x is likely to provide adequate coverage for most applications in cattle. Furthermore, the trend we observe here is consistent across two distinct cattle breeds, Angus, and Holstein.

Figure 1: Non-reference and overall concordance for unfiltered SNPs stratified by breed type. Concordance estimates were generated by comparing the imputed genotypes against the gold standard truth set from the haplotype reference panel. The X-axis represents the input dataset used for imputation. The Y-axis represents the concordance estimate. Colors represent the two breeds used in this experiment. Non-reference concordance is shown on the left panel, overall concordance is shown on the right panel.

Coverage

Overall Concordance Mean (Min-Max)

Non-Reference Concordance Mean (Min -Max)

Array

0.9846 ( 0.9601 - 0.9882 )

0.6859 ( 0.5853 - 0.7403 )

0.1x

0.9917 ( 0.9697 - 0.9934 )

0.8216 ( 0.7412 -0.8454 )

0.5x

0.9958 ( 0.9730 - 0.9967 )

0.9133 ( 0.8395 - 0.9252 )

1x

0.9966 ( 0.9736 - 0.9974 )

0.9308 ( 0.8606 - 0.9416 )

2x

0.9971 ( 0.9739 - 0.9979 )

0.9412 ( 0.8735 - 0.9513 )

3x

0.9972 ( 0.9740 - 0.9981 )

0.9449 ( 0.8779 - 0.9571 )

4x

0.9973 ( 0.9741 - 0.9981)

0.9467 ( 0.8809 - 0.9588 )

Table 1: Overall and non-reference concordance estimates for each imputation run. Concordance estimates were computed by treating the reference panel genotypes as the truth.

Additionally, as depicted in Figure 2, mean non-reference concordance of SNPs across the minor allele frequency spectrum is also consistently higher for low-pass imputation than array-based imputation for both Holstein and Angus shown in the left and right panels, respectively. This finding further underscores the advantages of using low-pass sequencing instead of array-based genotyping for imputation in cattle, particularly for imputing sites with lower minor allele frequencies.

Similar to our observation in Figure 1, we also observe that while all coverages ranging from 0.1x to 4x outperform array-based imputation, the improvement in mean non-reference concordance estimates at coverages higher than 0.5x or 1x appear to result in diminishing returns in terms of improved imputation accuracy. This finding also suggests that for most applications, an average coverage of 0.5x should provide sufficient coverage for accurate imputation across the minor allele frequency spectrum in cattle.

To further explore these results at a finer scale, we also present two additional boxplots in Figure 3, which depict the non-reference concordance estimates of low-pass and array-based imputation results for Holstein on the left panel and Angus on the right panel, respectively. These results show that mean non-reference concordance across minor allele frequency bins shown in Figure 2 are generally in agreement with individual level estimations, suggesting that these results are not being driven by outliers.

Figure 2: Mean non-reference concordance for unfiltered SNPs by minor allele frequency in the haplotype reference panel. Non-reference concordance estimates were generated by comparing the imputed genotypes against the gold standard truth set from the haplotype reference panel. The X-axis shows the minor allele frequency bins. The Y-axis shows the mean non-reference concordance (NRC) for each bin. Colors represent different coverages used as input data for imputation. Results for Holstein are shown on the left panel and Angus on the right panel.

Figure 3: Non-reference concordance for unfiltered SNPs stratified by minor allele frequency in the haplotype reference panel. Non-reference concordance estimates were generated by comparing the imputed genotypes against the gold standard truth set from the haplotype reference panel. Each data point represents one of the subjects in the experiment. The X-axis shows the minor allele frequency. The Y-axis shows the non-reference concordance (NRC) estimate for each subject. Colors represent different coverages used as input data for imputation. Results for Holstein are shown on the left panel and Angus on the right panel.

Conclusions:

The results of this experiment demonstrate that low-pass sequencing plus imputation, even at a coverage as low as 0.1x, is a highly effective approach for generating comprehensive genome-wide information with high accuracy in cattle. Low-pass plus imputation offers superior performance and accuracy compared to traditional genotyping arrays when the data is to be imputed to a genome-wide reference panel, making it an attractive tool for researchers and breeders seeking to identify novel genetic variation in cattle and explore the genetic basis of important traits in breeding programs. It also offers an opportunity to improve genomic prediction accuracy. While mid density genotyping arrays are sufficient for genomic selection in inbred populations with limited numbers of haplotype segments (Pocrnic et al., 2016), this experiment makes clear that there is abundant diversity that can potentially be deployed for genetic improvement that is better captured by sequencing than limited arrays.

In addition to providing a more comprehensive genome-wide data, low-pass plus imputation is also more cost effective compared to traditional genotyping arrays. This is particularly important for researchers and breeders who work with large samples or have limited resources, but require comprehensive genomic data to drive their research and breeding programs. Furthermore, low-pass plus imputation has more flexibility than arrays and allows for a more reliable detection of a large number of genomic variations across the genome such as copy number variation or indels that are often not well captured by genotyping arrays. Additionally, Gencove has recently also collaborated with Neogen to combine low-pass sequencing with targeted capture to provide the genome wide accuracy of low-pass with improved resolution at key mendelian loci such as the Polled phenotype locus. In summary, our results demonstrate that low-pass combined with imputation outperforms array-based imputation and is an attractive alternative for generating comprehensive genome-wide information with high accuracy in cattle. This powerful alternative provides researchers and breeders with an affordable yet efficient and reliable method to explore novel and known genetic variation in cattle breeding and research programs.

Bibliography

Li JH, Mazur CA, Berisa T, Pickrell JK. Low-pass sequencing increases the power of GWAS and decreases measurement error of polygenic risk scores compared to genotyping arrays. Genome Res. 2021 Apr;31(4):529-537. doi: 10.1101/gr.266486.120. Epub 2021 Feb 3. PMID: 33536225; PMCID: PMC8015847.

Pocrnic I, Lourenco DA, Masuda Y, Legarra A, Misztal I. The Dimensionality of Genomic Information and Its Effect on Genomic Prediction. Genetics. 2016 May;203(1):573-81. doi: 10.1534/genetics.116.187013. Epub 2016 Mar 4. PMID: 26944916; PMCID: PMC4858800.