Blog

Jeremy Li, Head of Data Science - Mar 11, 2021

New publication in collaboration with the USDA: "Assessment of Imputation from Low-Pass Sequencing to Predict Merit of Beef Steers"

Along with Warren Snelling and other colleagues at the USDA MARC (Meat Animal Research Center), we recently performed a study investigating the utility of imputation from low pass sequencing data in cattle in the context of genomic prediction for beef steers. This study is now published in MDPI Genes and can be accessed at the following link [0]. In this blog post, we briefly review the motivations behind this study and outline the main results.

Motivation

Commercial genotyping arrays are currently routinely used in genomic prediction for beef cattle due to the additional predictive validity that genomic data provides on top of pedigree information when modeling breeding values for phenotypes of commercial interest. Recent literature suggests that particularly for multi-breed populations, the inclusion of functional sequence variants can further increase the accuracy of such predictions [1,2,3]. However, one of the inherent limitations of currently available genotyping arrays for cattle is that they do not assay much of the known functional variation in beef cattle. Low pass sequencing (LPS) plus imputation to a haplotype reference panel addresses this limitation and streamlines the process, since one can accurately impute to a comprehensive set of functional variants, as the exact set of imputed variants can be tweaked at the software level without having to design a new assay at a molecular level.

Study Design

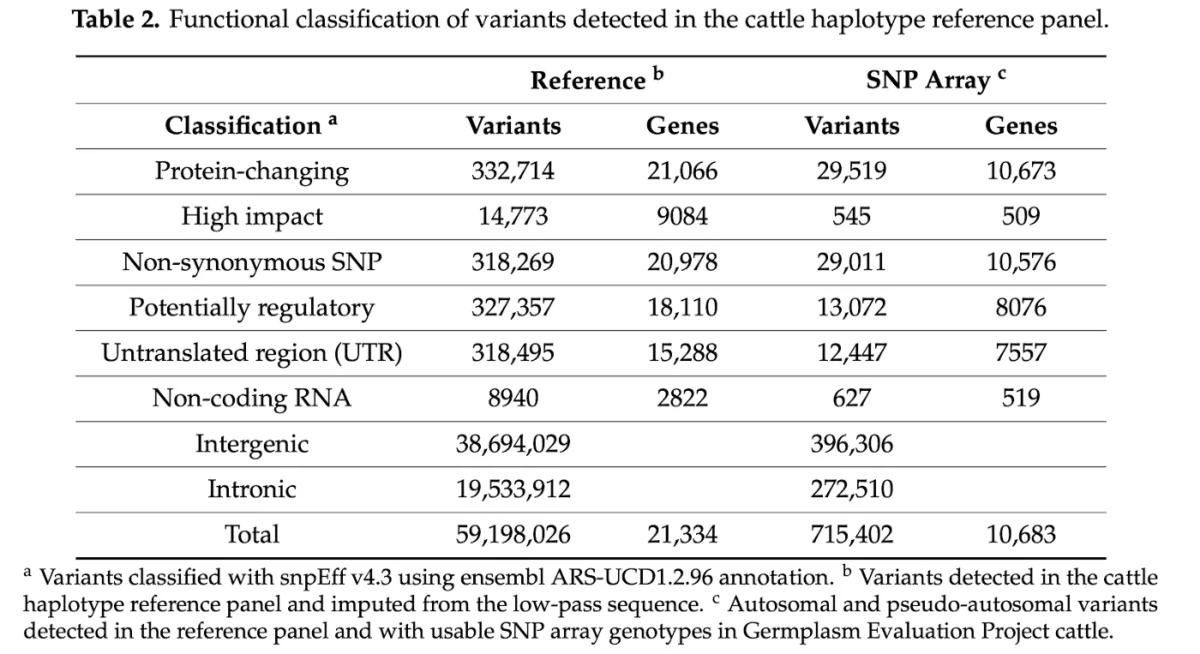
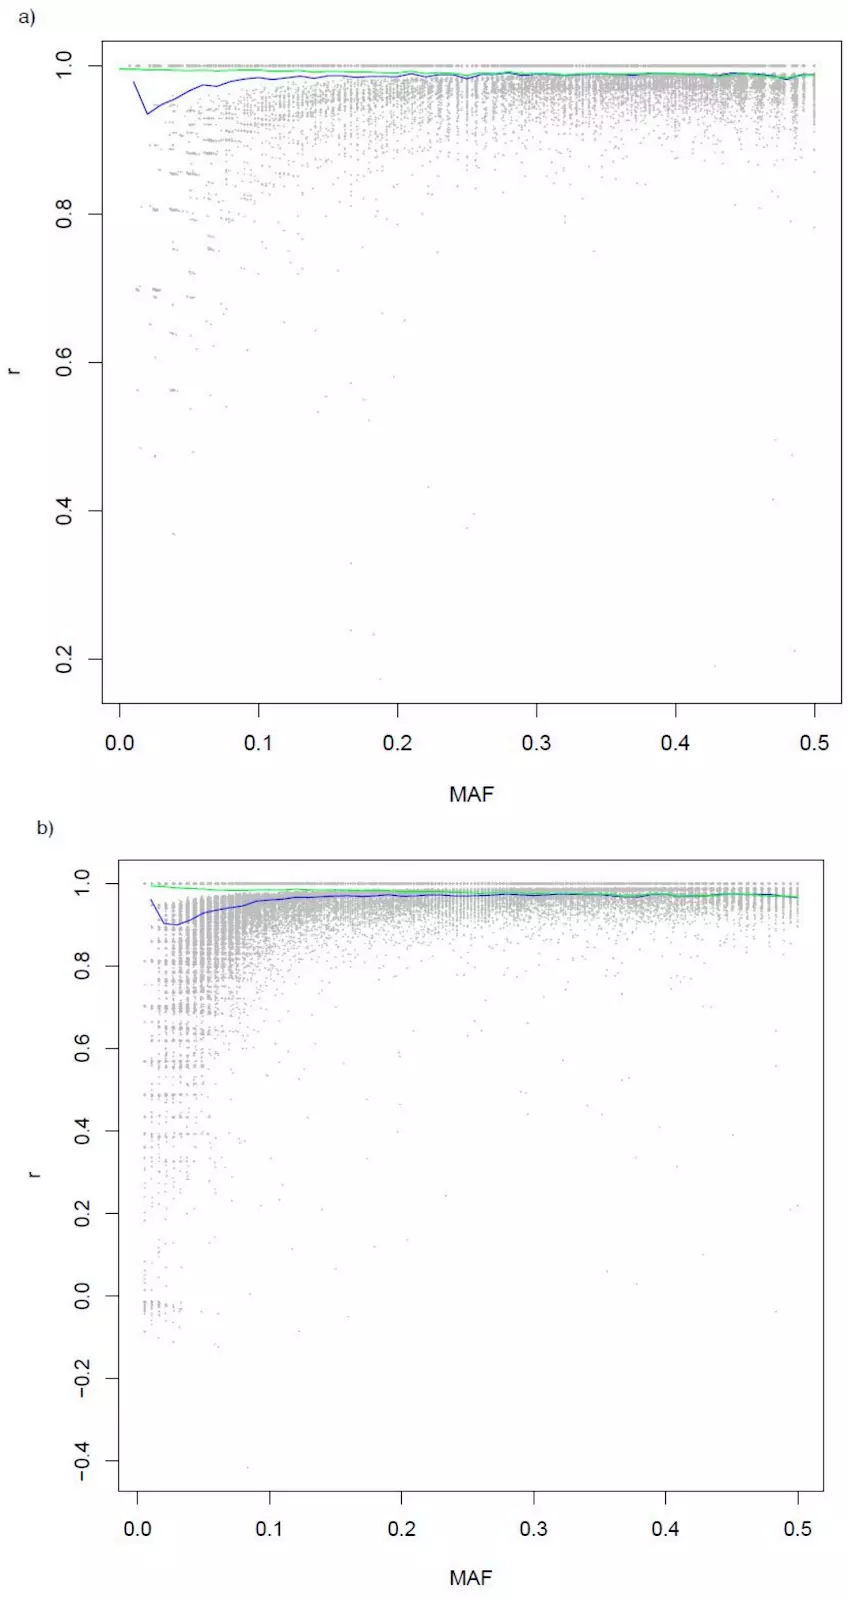
In this study, we evaluated the performance of low-pass sequencing in beef cattle by downsampling existing, high-depth (10x) sequence to the equivalent of 1x coverage for 77 steers, and imputed the data to a diverse haplotype reference panel comprising ~60MM variants and 946 individuals. These imputed genotypes were then compared to existing array data (genotype calls at a combined BovineHD + GGP-F250 variant set) for these same 77 individuals to examine the performance of imputation when compared to genotypes directly assayed at the molecular level (i.e., calls from a genotyping array).

> We then computed (1) estimated breeding values (EBVs) (models using the pedigree + known phenotypes), (2) genomic estimated breeding values (GEBVs) (models using genotypes + the pedigree + known phenotypes), and (3) estimated variant-level effect sizes, for three phenotypes of commercial interest: birth weight (BW), postweaning gain (PWG), and marbling (MARB) —all with the 77 steers held out of the training set. In the last model one does not directly estimate the breeding value as in (1) and (2), but rather, one applies the pre-estimated variant weights to genotypes from an arbitrary individual’s genotypes to obtain the individual’s molecular breeding value (MBV).

Reference Panel

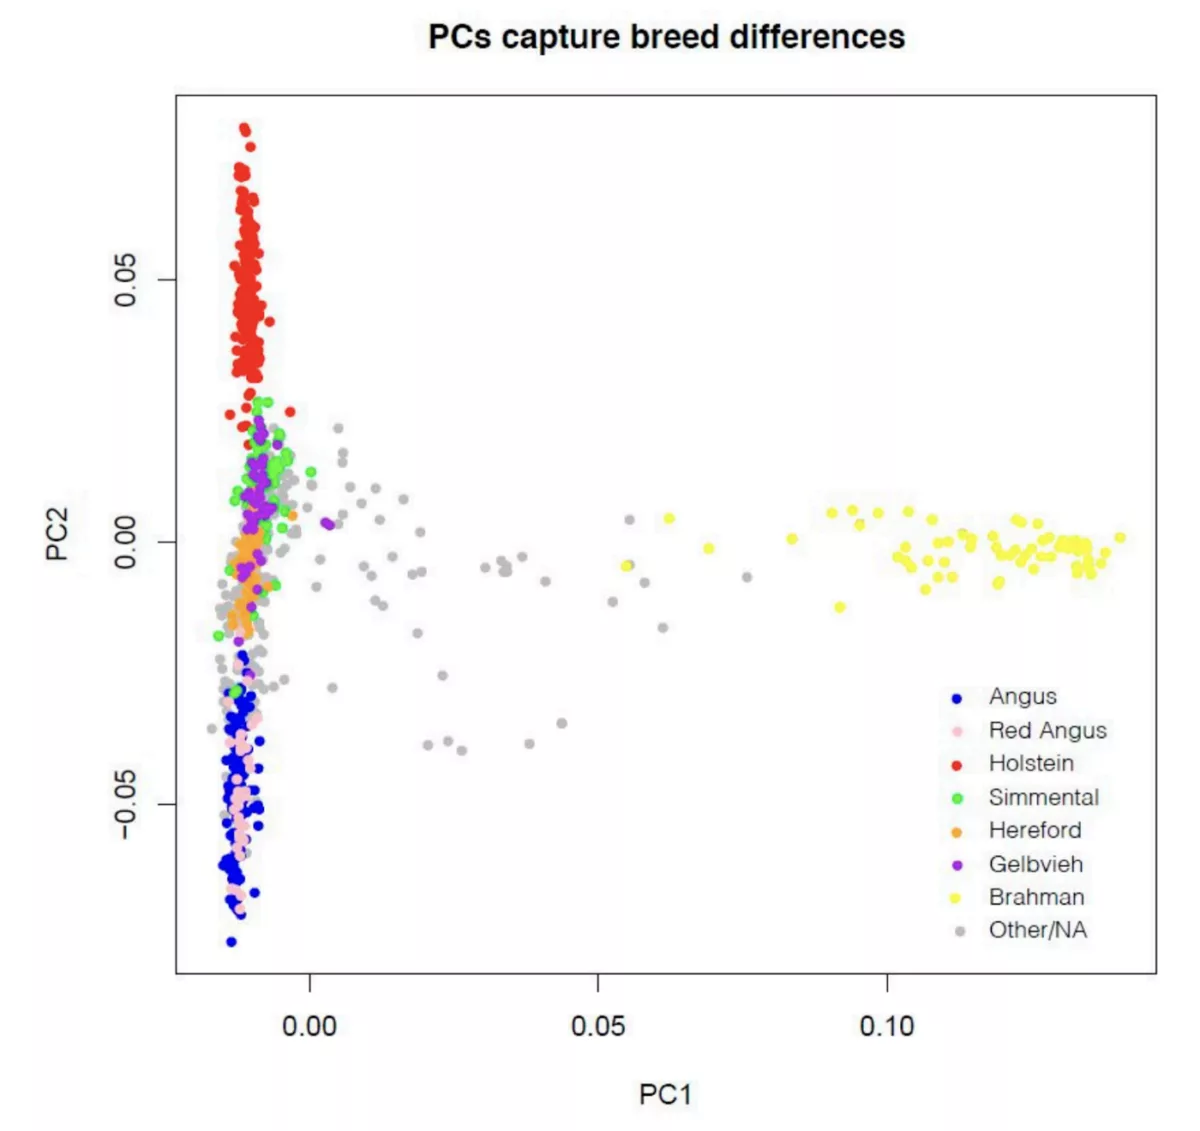
Before we describe the results of our study, we take some time to discuss the haplotype reference panel used. Over the last year and a half, we expanded our set of reference individuals from the ~500 individuals in our initial cattle product release (initially described here) to a set of 946 individuals spanning an even larger range of genetic diversity. At a high level, this reference panel comprises 946 individuals from B. taurus and B. indicus-related breeds, and spans the range of breeds most commonly found in the US (Figure 1). These genotype calls were generated using an in-house implementation of the GATK best practices pipeline and the haplotype reference panel comprises ~60MM SNPs and short indels.

Figure 1: The first two principal components of the genotypes of the individuals in our haplotype reference panel. The first PC mainly captures the distinction between B. taurus and B. indicus breeds, as expected. In total, the first two principal components explain 11% of the genetic variation within these individuals.

One of the most notable differences between the genotyping array and LPS + imputation is the sheer number of variants assayed by the former compared to the latter — fundamentally, the limitation here is having a haplotype reference panel that adequately represents the genetic diversity of the populations of interests — if one can assemble a sufficient amount of genomic data to do that, one can assay a far greater number of variants for any given sample.

Figure 2 illustrates the difference in the number of variants for which one obtains variant calls between samples having undergone LPS + imputation vs genotyping arrays. Here, the variants called by either assay are classified according to their inferred functional status using snpEff. Depending on the exact category, the number of variants assayed by LPS + imputation is 10–100x the number captured by the SNP array, therefore providing vastly greater resolution for any sort of fine mapping and trait mapping work that one might want to perform on assayed individuals.

Figure 2: Functional classification of variants detected in the cattle haplotype reference panel compared to the same classification on the variants on the array. Note that the number of variants in the reference panel for any given classification far exceeds the corresponding number for the SNP array.

Concordance Results

Overall, we observed that imputation from low-pass sequencing was highly accurate, with an average correlation at the variant level of r = 0.99 between chip genotypes and imputed sequence genome-wide, and an r-value of 0.97 between imputed sequence and gold-standard genotype calls at transcript sequence. For the following, we restricted analysis to the set of sites that overlapped between the variants on the combined BovineHD + GGP-F250 dataset and the sequence-based haplotype reference panel, an intersection of ~715k variants.

Notably, the correlation between chip genotypes and imputed sequence was quite high across the entire minor allele frequency (MAF) spectrum, with the lowest r within 0.01 MAF increments being 0.93 at MAF = 0.02, and with an r > 0.98 for all increments >0.08. Agreement between genotypes imputed from downsample sequence and called from the original, high-depth transcript sequence for the same individuals was somewhat less, but followed a qualitatively similar pattern across the MAF spectrum. The lowest r in that case was for the MAF=0.03 bin with r = 0.9, and all MAF bins above 0.08 had r > 0.95.

Overall, these results emphasize the high performance of imputation of low-pass sequencing data genome-wide across the MAF spectrum even when compared to genotypes deriving from directly molecularly assayed variants (i.e. genotyping arrays).

Figure 3: Relationship between imputation accuracy as expressed as a correlation r between genotypes imputed from sequence and called from SNP arrays (a) or transcript sequence (b), and minor allele frequency (MAF). Mean correlation between imputed and called genotypes within 0.01 MAF increments is shown by blue lines, and the green lines show mean concordance within the 0.01 MAF increments.

Genomic Prediction

We computed EBVs, GEBVs, and MBVs for birth weight, postweaning gain, and marbling for these 77 individuals using both imputed sequence and array data and compared the results. As these individuals are part of a population for which there has been historical phenotype and genotype data collected, they were particularly well suited for such an analysis. In particular:

  • The corresponding pedigree comprised ~120k animals
  • We had known BW phenotypes for 79k animals
  • We had known PWG phenotypes for 69k animals
  • We had MARB phenotypes for 39k animals
  • We had array genotypes for 19k animals

Given this data, we were then equipped to estimate EBVs (breeding values directly estimated from pedigree + phenotype information), GEBVs (breeding values directly estimated from genomic + pedigree + phenotype information), and MBVs (breeding values estimated as the sum of pre-calculated variant-level effects multiplied by the genotype information [cf. polygenic risk scores]). After estimating these values for different subsets of variants (in order to examine the effect of the chosen variant set on estimated breeding values), we examined the correlation between the computed MBVs and (G)EBVs for each subset and phenotype. We found that in all cases, the correlations between MBVs and (G)EBVs were within standard errors, indicating that these methods all give relatively similar results for these data.

The correlation for all phenotypes and variant subsets for MBVs between those estimated from the array data and the LPS data were all >0.96, indicating a high level of agreement between breeding values estimated from array and sequence data, and demonstrating that LPS recapitulates results from genomic prediction methods using genotyping arrays.

Conclusions

The results from this study indicate that low pass sequence + imputation to a haplotype reference panel accurately assays variants regularly captured by commercial genotyping arrays for beef cattle and provides comparable results in the genomic prediction of commercially relevant traits. At the same time, LPS + imputation enables the reliable assaying of a vastly larger set of functionally relevant variants compared to genotyping arrays, and provides accurate results across the allele frequency spectrum. By making LPS and the tools to interpret the results routinely available, we hope to pave the way to improved genomic predictions.

Indeed, since the completion of this study, we have further expanded our haplotype reference panel to include an additional ~1000 individuals encompassing an even larger degree of genetic diversity in cattle. We’re excited to announce that this pipeline is now publicly available on our systems, and existing customers can access this pipeline by choosing the project configuration “Cattle Low-Pass v3.0 BETA” when creating a new Gencove project. As the configuration name indicates, we’re still testing this out, so please reach out with any suggestions or comments!

Acknowledgements

We thank Warren Snelling for writing the manuscript off which this blog post is based, and our colleagues at the USDA ARS MARC for their continued collaboration. For more details regarding the exact methodology and for more information on additional analyses performed in the study, please refer to [0].

Bibliography

[0] Snelling, W.M.; Hoff, J.L.; Li, J.H.; Kuehn, L.A.; Keel, B.N.; Lindholm-Perry, A.K.; Pickrell, J.K. Assessment of Imputation from Low-Pass Sequencing to Predict Merit of Beef Steers. Genes 2020, 11, 1312.

[1] Moghaddar, N.; Khansefid, M.; van der Werf, J.H.J.; Bolormaa, S.; Duijvesteijn, N.; Clark, S.A.; Swan, A.A.; Daetwyler, H.D.; MacLeod, I.M. Genomic prediction based on selected variants from imputed whole-genome sequence data in Australian sheep populations. Genet. Sel. Evol. 2019, 51, 72.

[2] MacLeod, I.M.; Bowman, P.J.; vander Jagt, C.J.; Haile-Mariam, M.; Kemper, K.E.; Chamberlain, A.J.; Schrooten, C.; Hayes, B.J.; Goddard, M.E. Exploiting biological priors and sequence variants enhances QTL discovery and genomic prediction of complex traits. BMC Genom. 2016, 17, 144

[3] Xiang, R.; Berg, I.v.d.; MacLeod, I.M.; Hayes, B.J.; Prowse-Wilkins, C.P.; Wang, M.; Bolormaa, S.; Liu, Z.; Rochfort, S.J.; Reich, C.M.; et al. Quantifying the contribution of sequence variants with regulatory and evolutionary significance to 34 bovine complex traits. PNAS 2019, 116, 19398–19408.