Blog

Mamad Ahangari, Data Scientist - Sep 09, 2024

Utilizing RNA-seq for genotype imputation and eQTL mapping without additional genotyping

RNA-sequencing has revolutionized human genomics by offering insights into gene expression and the broader transcriptomic landscape. This powerful technology is particularly impactful in fields such as oncology, drug development, and personalized medicine, where it allows researchers to identify biomarkers and develop targeted therapies by measuring gene expression levels and detecting RNA transcript mutations. 

However, the potential of RNA-seq data can extend beyond expression analyses. One emerging use is leveraging complementary DNA (cDNA) reads from RNA-seq to perform genotype imputation1. While RNA-seq primarily captures reads from transcribed regions, these, when combined with off-target reads, provide a valuable backbone for genotype imputation. By leveraging these reads, we can impute missing genotypes to fill in the gaps in regions where there is limited or no sequencing coverage, and therefore complement the transcriptomic data with genome-wide genotypes without the need for additional sequencing. This dual benefit maximizes the value of RNA-seq data for more comprehensive and integrative downstream analyses such as eQTL studies that require genotype data.

In this blog post, we outline an internal evaluation we performed to test the accuracy of genotype imputation from RNA-seq data, in addition to a subsequent replication of large effect-size cis-eQTL detection using the 1000 Genomes data.

Genotype imputation from RNA-seq Data

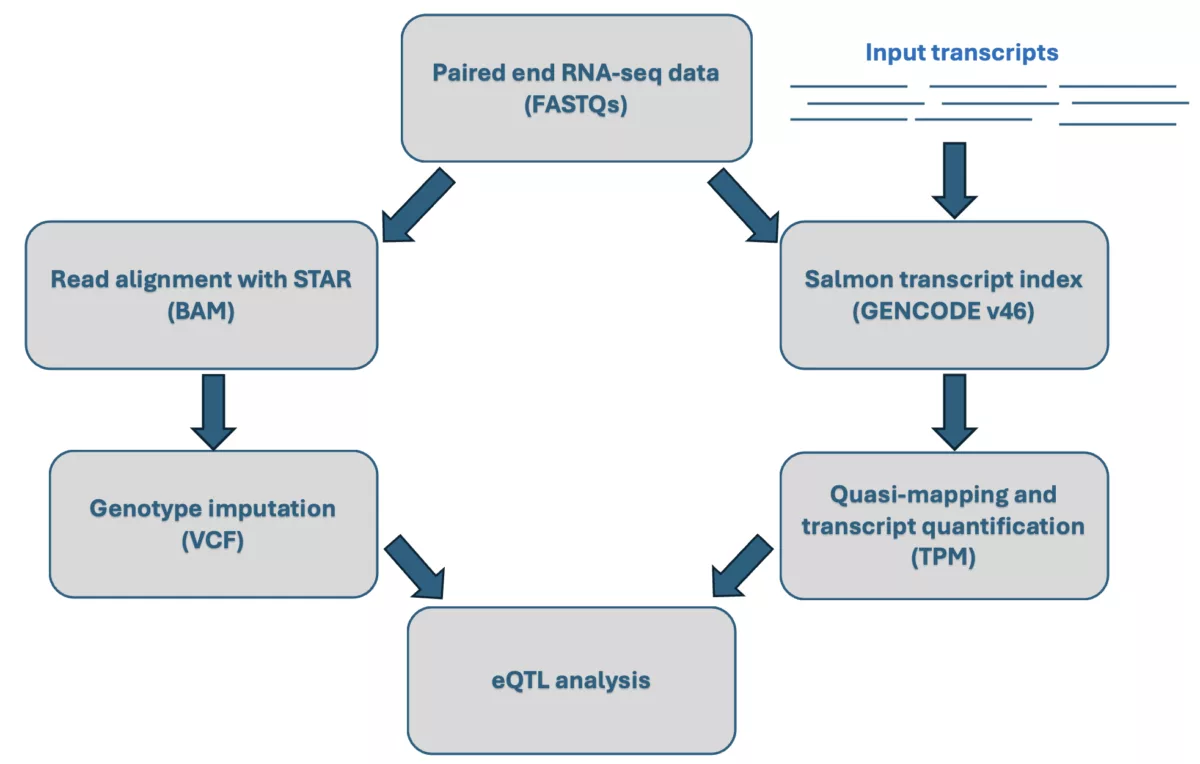
At Gencove, we offer a cost-effective solution to generate high quality genome-wide genotypes from low-coverage whole genome sequencing data through our advanced imputation pipelines. In this experiment, we used RNA-seq data from the 1000 Genomes Project Phase 1 2 to test the performance of our imputation pipeline with RNA-seq data as in input. This report outlines the results of this experiment, focusing on two main goals:

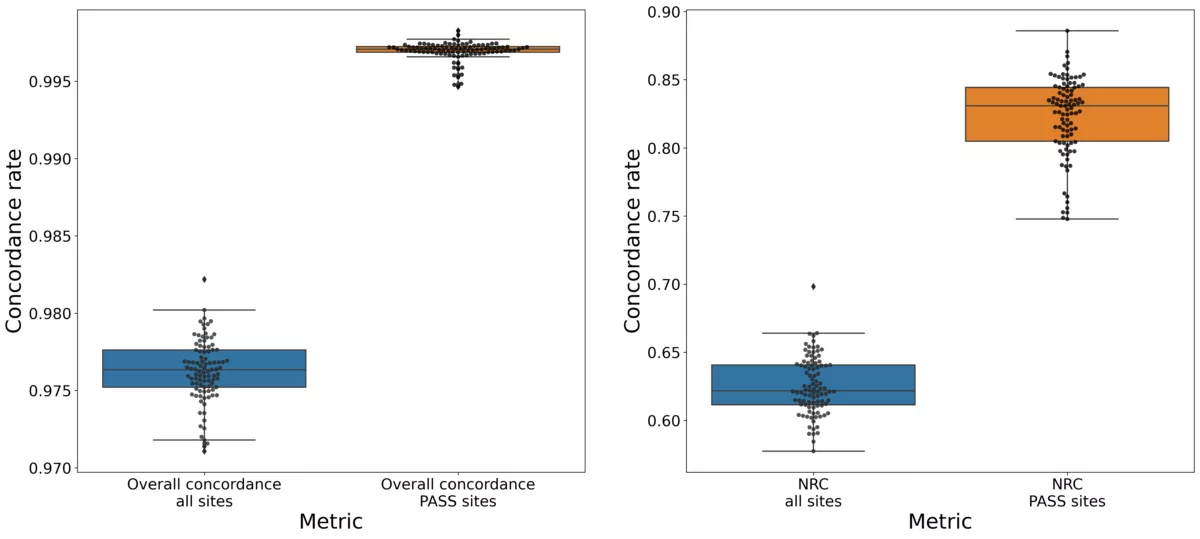
  1. Evaluating the accuracy of genotype imputation using RNA-seq data processed through the standard Gencove pipeline.
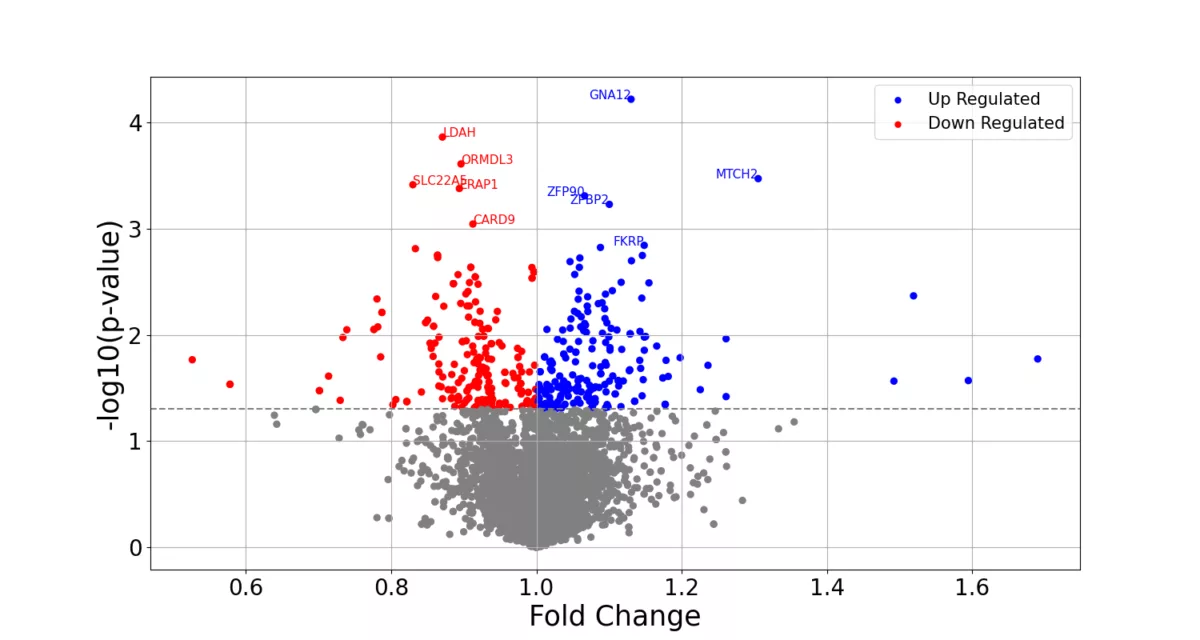
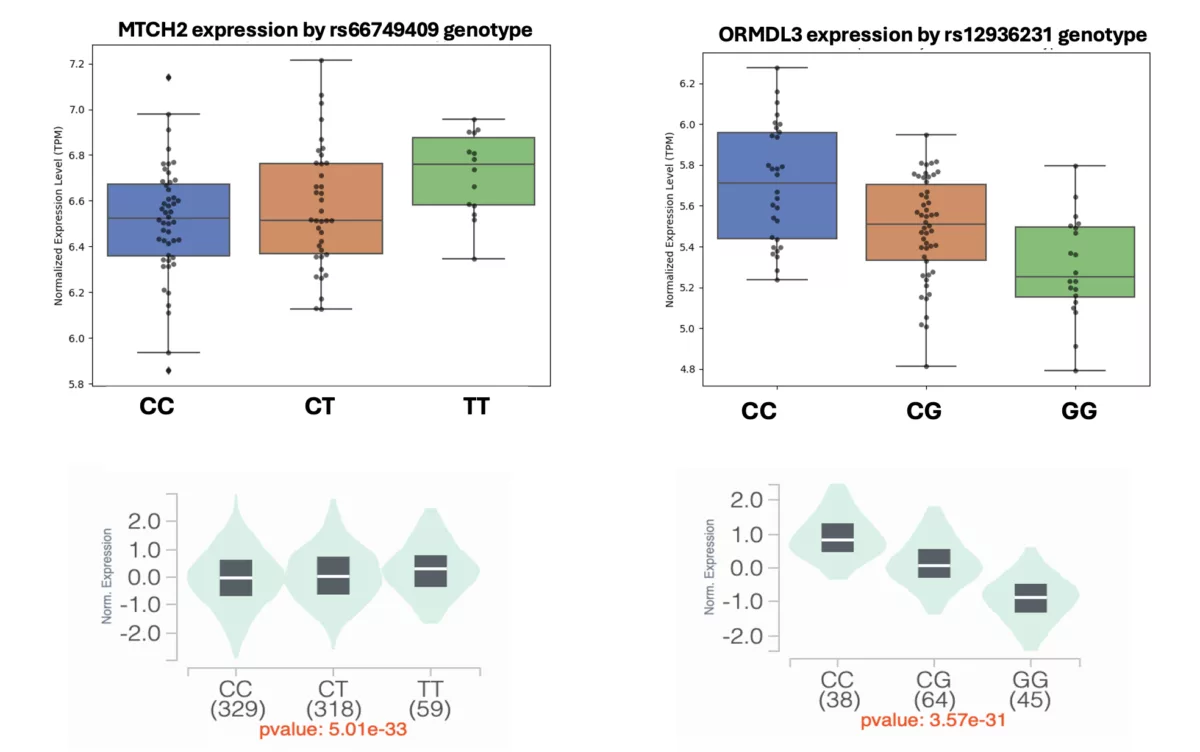
  2. Replicating large-effect cis-expression quantitative trait loci (cis-eQTLs) by integratively analyzing the imputed genotypes and gene expression data derived from RNA-seq.

Figure 1. The RNA-seq data from the 1000 Genomes Project was processed through two parallel pipelines to generate imputed genotypes and transcript quantification for the eQTL analysis. STAR was used to align the sequencing reads to the reference genome followed by genotype imputation through the Gencove pipeline, producing the final imputed VCF files. The Salmon quasi-mapping and transcript quantification pipeline was used to process the transcripts and generate TPM values. The imputed genotypes and transcript quantifications were then integrated for downstream eQTL analysis. 

We processed RNA-seq data from 100 randomly selected individuals in the 1000 Genomes Project, consisting of 80 European and 20 African samples. These samples were processed through our standard leave-one-out imputation pipeline, which is typically used for low-pass whole genome sequencing data. Due to the unique characteristics of RNA-seq data such as non-uniform coverage and variability in transcript abundance, we changed our default alignment software from BWA to STAR 3, a specialized RNA-seq aligner, to handle RNA-seq spliced reads more effectively. Our imputation results shows an impressive overall concordance rate of > 99% and non-reference concordance (NRC) of > 82% sites passing filter between the imputed genotypes from RNA-seq data and truth genotypes obtained from whole genome sequencing of the same subjects, indicating that our standard imputation pipeline performs reliably even with RNA-seq data. Despite the uneven coverage in RNA-seq data, we found that the relationship between the effective coverage of RNA-seq samples and the imputation performance was only slightly worse than standard whole-genome low pass WGS data 4, suggesting that the high coverage in transcribed regions provided sufficient information for accurate genotype imputation.

Figure 2. Box plots showing the overall and non-reference concordance of imputed genotypes compared to true WGS genotypes. The panel on the left represents overall concordance. The second panel on the right represents non-reference concordance (NRC). Each data point corresponds to one of the samples. Blue box plot shows all sites. Yellow box plot shows PASS sites. 

Replication of large-effect cis-eQTLs from the 1000 Genomes project

After confirming the high accuracy of genotype imputation from the RNA-seq data through our pipeline, the second part of the experiment focused on replicating large effect cis-eQTLs identified in the original 1000 Genomes Project study 5 published in 2013. We selected 183 of the top eQTLs identified in that study that were also present in our imputation reference panel, and aimed to replicate the effect of these eQTLs on their nearby genes to demonstrate the feasibility of carrying out eQTL analysis using our imputed genotypes.

RNA-seq reads were processed using the Salmon pipeline 6, which efficiently quantifies transcript abundances by directly mapping reads to a reference transcriptome and generating transcript per million (TPM) data, allowing for rapid and accurate quantification of the RNA-seq data. Transcript data from GENCODE v46 7 were used to build the transcriptome reference data for Salmon, and the TPM values were log2 transformed to ensure consistency across the samples. The eQTL analysis was carried out using Matrix eQTL in R, by performing linear regression to associate eQTLs with gene expression data.

Despite the smaller sample size in our experiment, we successfully replicated several major large-effect cis-eQTL signals identified by the original study, with the top 10 replicated signals highlighted in the volcano plot below. Although the statistical significance of the results in our experiment was slightly reduced due to our smaller sample size, the overall trends remained highly consistent, demonstrating the reliability of our imputed genotypes for eQTL analysis with RNA-seq data.

Figure 3. Volcano plot showing the strength and direction of gene expression changes associated with the top eQTLs. Fold change shown on the x-axis and -log10 p-values on the y-axis. Fold change represents the gene expression difference between homozygous reference and homozygous alternate individuals. Upregulated genes identified by eQTLs are shown in blue, while downregulated genes are shown in red. The top 10 significant signals are highlighted with gene names, including the top 5 upregulated and top 5 downregulated genes. The analysis was performed using eQTLs imputed using the Gencove pipeline. 

We further validated these findings by comparing the gene expression changes influenced by these eQTLs with data from the GTEx database 9, confirming high concordance in the direction of effect between the two datasets, further reinforcing the reliability of our imputed genotypes in quantifying biologically meaningful eQTL associations. Below, we highlight two of these examples. 

For example, rs6674909, associated with the gene MTCH2, shows distinct expression levels depending on the genotype, with the alternate allele significantly increasing MTCH2 expression. MTCH2 plays a role in mitochondrial function and apoptosis, and its dysregulation has been linked to metabolic disorders such as obesity.

Similarly, rs12936231, an eQTL associated with the gene ORMDL3, shows an opposite effect, where individuals with the homozygous reference genotype have significantly higher expression of this gene compared to those with the homozygous alternate genotype. Changes in the expression levels of ORMDL3 have been implicated in various inflammatory and immune responses such as asthma and ulcerative colitis. These results demonstrate how these genetic variants, acting as eQTLs, influence gene expression and reinforce both the biological significance of these findings and the accuracy of our imputed genotypes for carrying out these analyses.

Figure 4. The relationship between eQTLs and gene expression for the MTCH2 and ORMDL3 genes. The left two panels display the expression of MTCH2 associated with rs66749409, with the top panel showing the boxplot from our experiment and the bottom panel presenting data from the GTEx database. The right two panels show the expression of ORMDL3 associated with rs12936231. This comparison demonstrates the high consistency of eQTL signals between our imputed genotypes and independent GTEx data. 

A cost effective solution to obtain accurate genotype calls from RNA-seq data.

Despite the uneven genome coverage of RNA-seq data, we found that it can be effectively leveraged by our imputation pipeline for accurate genotype imputation. With approximately half of the genome being intronic, the low but still detectable RNA-seq coverage in these regions provides additional value information for genotype imputation. This off-target sequencing, combined with the high coverage in transcribed regions, provides a comprehensive foundation for inferring haplotype blocks for genotype imputation. This approach provides a cost-effective and efficient alternative to additional sequencing or genotyping, enabling investigators to broaden the potential of RNA-seq data for more integrative downstream analyses that leverage both transcriptomic and genotypic data. Our experiment serves as a clear example of the feasibility of this approach by successfully conducting eQTL analysis on this dataset.

In addition to integrating the STAR RNA-seq aligner into our pipeline to ensure optimal alignment accuracy, we also tested the performance of RNA-seq imputation with our standard pipeline which utilizes BWA for alignment. Unlike STAR, BWA is not splice-aware, which reduces its ability to handle spliced reads effectively. This resulted in a somewhat reduced NRC of 0.78, a 5% drop in concordance, which highlights the importance of using the right tools for RNA-seq data to achieve optimal imputation accuracy.

Many organizations and research groups already possess vast RNA-seq datasets from numerous samples. By processing these existing RNA-seq datasets through our imputation pipeline, researchers can easily complement their transcriptomic data with high-quality genome-wide genotypes without additional sequencing effort and expand the scope for downstream analyses of RNA-seq data as demonstrated in this report.

As we continue to add new features to our pipeline, we expect further improvements in both accuracy and efficiency, making RNA-seq genotype imputation a highly feasible and valuable tool for large-scale research initiatives as well as clinical and drug development applications. 

References:

  1. Razi, A., Lo, C. C., Wang, S., Leek, J. T., & Hansen, K. D. (2024). Genotype prediction of 336,463 samples from public expression data. bioRxivhttps://doi.org/10.1101/2023.10.21.562237 

  2. Montgomery, S. B., Sammeth, M., Gutierrez-Arcelus, M., Lach, R. P., Ingle, C., Nisbett, J., Guigo, R., & Dermitzakis, E. T. (2010). Transcriptome genetics using second generation sequencing in a Caucasian population. Nature, 464(7289), 773-777. https://doi.org/10.1038/nature08903 

  3. Dobin, A., Davis, C. A., Schlesinger, F., Drenkow, J., Zaleski, C., Jha, S., Batut, P., Chaisson, M., & Gingeras, T. R. (2013). STAR: Ultrafast universal RNA-seq aligner. Bioinformatics, 29(1), 15-21. https://doi.org/10.1093/bioinformatics/bts635 

  4. Li, J. H., Mazur, C. A., Berisa, T., & Pickrell, J. K. (2021). Low-pass sequencing increases the power of GWAS and decreases measurement error of polygenic risk scores compared to genotyping arrays. Genome Research, 31(4), 529–537. https://doi.org/10.1101/gr.266486.120 

  5. Lappalainen, T., Sammeth, M., Friedländer, M., ’t Hoen, P. A. C., Monlong, J., Rivas, M. A., Gonzalez-Porta, M., Kurbatova, N., Griebel, T., Ferreira, P. G., Barann, M., Wieland, T., Greger, L., van Iterson, M., Almlof, J., Ribeca, P., Pulyakhina, I., Esser, D., Giger, T., … Guigó, R. (2013). Transcriptome and genome sequencing uncovers functional variation in humans.*Nature, 501, 506-511. https://doi.org/10.1038/nature12531 

  6. Patro, R., Duggal, G., Love, M. I., Irizarry, R. A., & Kingsford, C. (2017). Salmon provides fast and bias-aware quantification of transcript expression. Nature Methods, 14(4), 417-419. https://doi.org/10.1038/nmeth.4197 

  7. Frankish, A., Carbonell-Sala, S., Diekhans, M., Jungreis, I., Loveland, J. E., Mudge, J. M., Sisu, C., Wright, J. C., Arnan, C., Barnes, I., Banerjee, A., Bennett, R., Berry, A., Bignell, A., Boix, C., Calvet, F., Cerdán-Vélez, D., Cunningham, F., Davidson, C., Donaldson, S., ... Flicek, P. (2023). GENCODE 2023 update: Comprehensive coding and non-coding gene annotation in human and mouse. *Nucleic Acids Research*, 51(D1), D942–D949. https://doi.org/10.1093/nar/gkad1104 

  8. Shabalin, A. A. (2012). Matrix eQTL: Ultra fast eQTL analysis via large matrix operations. Bioinformatics, 28(10), 1353-1358. https://doi.org/10.1093/bioinformatics/bts163 

  9. The GTEx Consortium. (2020). The GTEx Consortium atlas of genetic regulatory effects across human tissues. Science, 369(6509), 1318-1330. https://doi.org/10.1126/science.aaz1776